Results and export
Everything you can take out of Nios, from the results workbook to charts.
Charts show the big picture, but reports and audits need the numbers behind them. The Results sheet holds every result of every activity, with how Nios calculated it. You can export it, the charts, and your input data.
Results sheet
Click Results on the Impacts page to open the sheet. It opens on the All view, which has one row per activity, in the same order as on Activities. Activities that aren't calculated yet are listed with empty results. Each row holds the activity and all its results:
- Activity columns: Every column from Activities, including your custom columns, in the same order.
- Nature results: The activity's impact and impact intensity. Then, for each environmental pressure (metric), its pressure, pressure intensity, impact, and impact intensity. Then the impact per pressure category and per ecosystem.
- Climate results: Emissions and emission intensity.
See how a value was calculated
Hover a metric's pressure or impact to see the calculation behind it:
- Pressure: The activity's amount, converted to the factor's currency and year, times the factor.
- Impact: The pressure times the characterization factor, for each ecosystem it affects.
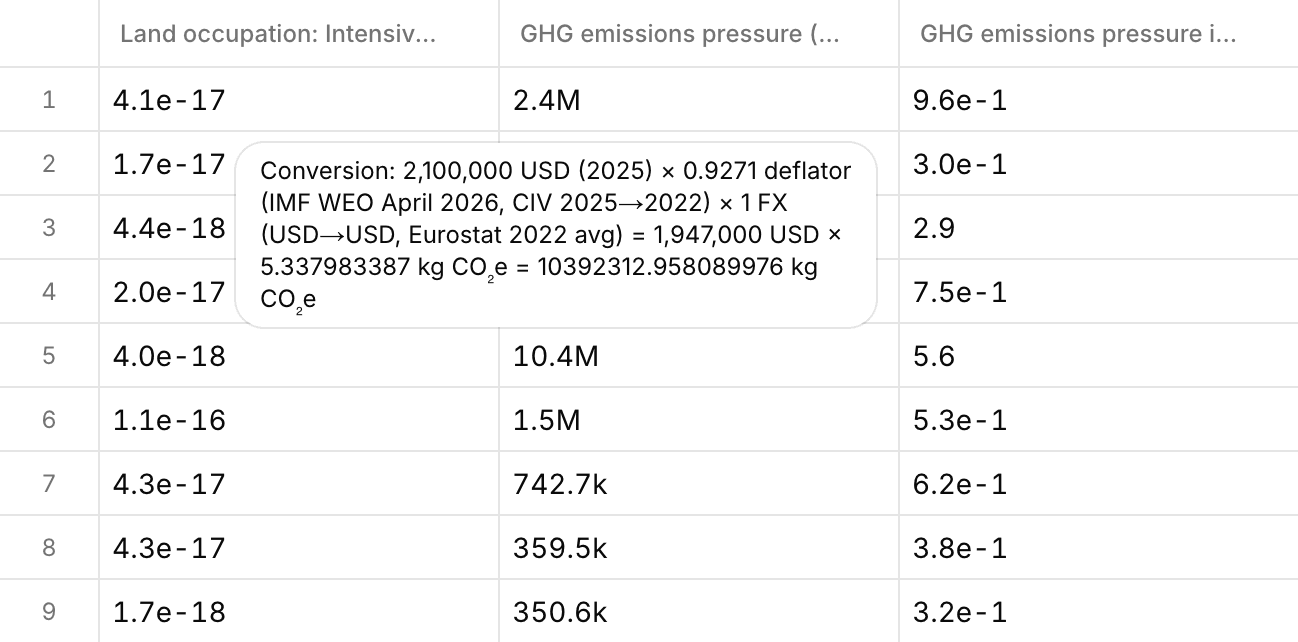
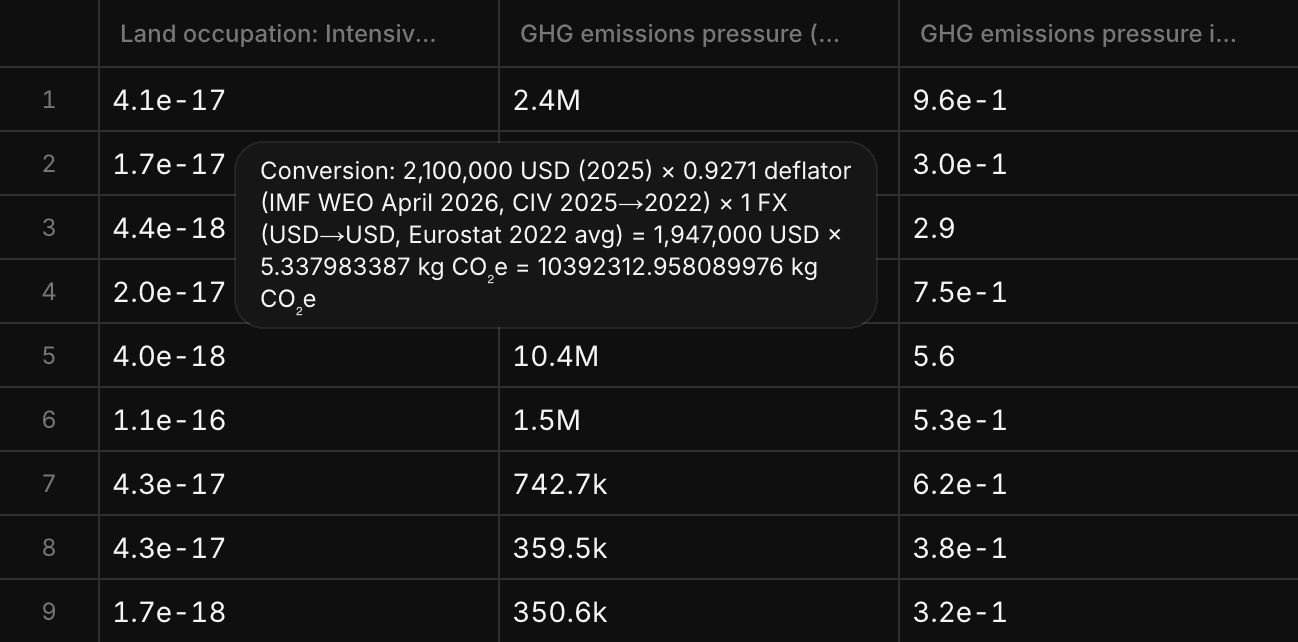
The calculation belongs to one activity, so it's only shown with one row per activity: in the All view with Goods & Services as the source.
Group rows by source
Choose a Source in the toolbar to group the rows. It's the same choice as in the Impact Source card: Goods & Services, the default with one row per activity, or Suppliers, Countries, Entity, Asset, or one of your custom columns. With Suppliers, for example, each row is one supplier:
- First column: Names the group, such as the supplier.
- Results: Add up across the group's activities. Intensities are calculated from the group's total spend.
- Activity columns: Keep a value only when all activities in the group share it, such as one country of production. Spend and quantity add up when the activities share a currency or unit.
A view saves its source, like its filters and sort.
Views
| View | Lens | Shows |
|---|---|---|
| All | Nature and Climate | Every column, as described above |
| Pressures | Nature | Impact and intensity per pressure category |
| Ecosystems | Nature | Impact and intensity for terrestrial, freshwater, and marine ecosystems |
Clicking a bar or a row in a chart card, such as a supplier in the Impact Source card, opens Results on the matching view and source. You can add your own views, see Views and filters.
Export results
Click Export results in the Results sheet. Nios downloads nios-<project>-<lens>-results.xlsx with one sheet, Results. It contains what you see:
- Columns: The columns visible in the current view, in its order.
- Rows: The rows the view's filters and your search show, grouped by the selected source.
- Calculations: On the Nature lens, in the All view with Goods & Services as source, every metric pressure and impact column gets a second column with its calculation, for example "GHG emissions pressure calculation". Together with a Collect export of your inputs, that lets a reviewer trace every Nature result.
Export charts
- One chart: Each card's export button saves it as SVG or PNG.
- All charts: Export all charts saves every card on the page in one ZIP file, as SVG or PNG.
PNG files have double resolution and work in slides. SVG files stay sharp at any size and can be edited in vector tools.
Which export for which job
| Job | Export |
|---|---|
| Share numbers with finance or management | Results workbook from a view with the columns they need |
| Build slides | Export all charts as PNG, or SVG to restyle them |
| Keep an audit trail | Results workbook from the Nature All view by Goods & Services, plus Export > All on the Collect pages |
| Export or edit your input data | Export on the Collect pages, see Import and export |