Measure impacts
Coverage and method
Check what a result covers and how it was produced before you share it.
Before you share a number, check what it covers and how Nios produced it. The Coverage and Method tabs in the side panel of the Impacts page answer both. Open them with Open panel in the top right.
Coverage tab
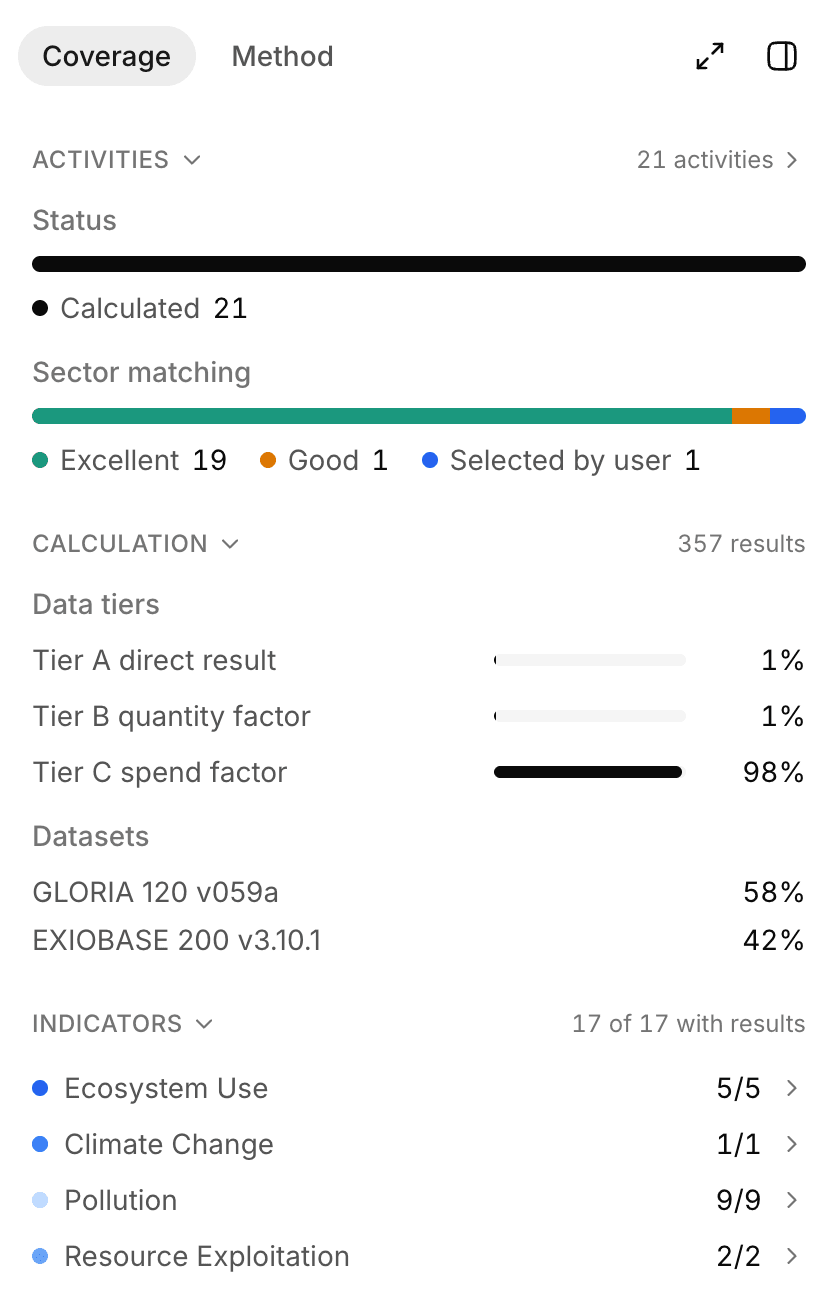
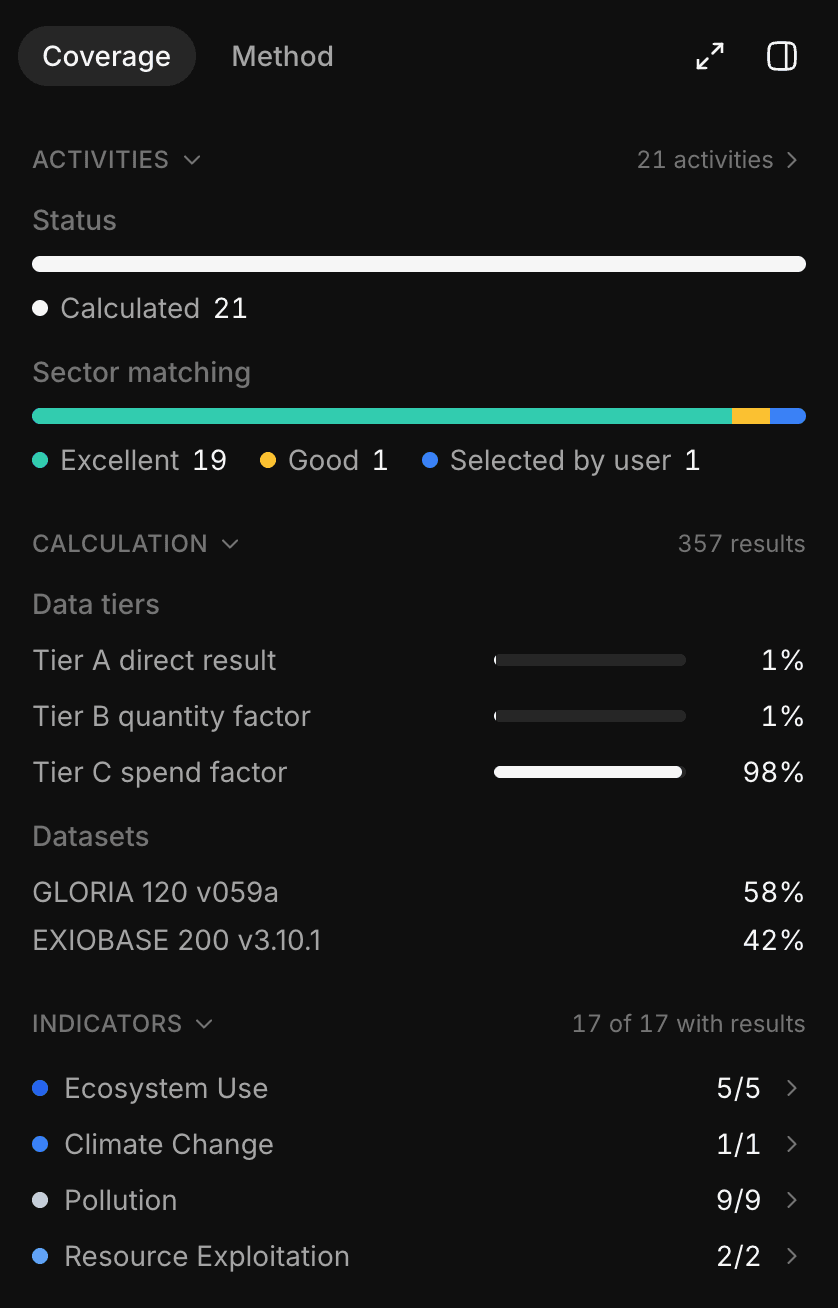
The Coverage tab shows how complete your results are.
| Section | What it shows |
|---|---|
| Activities | How many activities are Calculated, Not calculated, Pending calculation, or Awaiting matching, and how many have spend data |
| Sector matching | How base sectors were set: Excellent and Good matches, Selected by user, and Unresolved |
| Calculation | How many results Nios calculated |
| Data tiers | The share of calculated results, by count, that come from Tier A, B, and C impact inputs and from Nios defaults |
| Datasets | The share of calculated results, by count, from each factor dataset |
| Indicators | The environmental pressures (metrics) with results: up to 17 on Nature, 1 on Climate |
Activities that are not calculated or awaiting matching are missing from your totals. See Issues for why and how to fix them.
Method tab
The Method tab summarizes how your results were produced, so you can cite it in a report.
| Section | What it shows |
|---|---|
| Scope | Reporting period, system boundary (Cradle-to-gate: from raw material extraction to the supplier's gate), and GHG Protocol scopes |
| Characterization | The classification into IPBES pressure categories and the impact indicator, PDF·yr or t CO₂e |
| Datasets | The factor datasets with their reference year, the impact model, and the number of impact inputs |
| Settings | Outlier treatment, traced origins, ecosystem weighting, and base currency, explained in Project settings |
Change next to the settings opens Project settings. See Methodology for the calculation steps behind each entry.